Government Bond Yield Curve
March 3, 2022
What is the “Government Bond Yield Curve”?
The government bond yield curve plots yield against the maturity of government bonds with equal credit quality. Investors pay strong attention to the yield curve since it has predictive powers for inflation and the levels of economic activity. The US treasury yield curve, which compares the yields of short-term Treasury Bills (with a maturity of less than a year) with long-term Treasury Notes (two, three, five, and ten years) and bonds (twenty and thirty years), is the most commonly referenced government yield curve. The shape of the yield curve could be upward (normal), downward (inverted), sloping, flat, or humped. The normal yield curve is where longer-term bonds have higher yields than short-term ones, which is an indicator of economic expansion. On the other hand, an inverted yield curve signals recession.
Key Learning Points
- The government bond yield curve compares government bonds with equal credit quality, but different maturities against each other
- The US Treasury yield curve is the most commonly monitored government yield curve
- There are four key shapes of the yield curve – normal, inverted, flat, and humped
Understanding the Yield Curve
Due to its ability to predict potential economic output, the yield curve has broader application and is also used as a benchmark rate for consumer lending or mortgages. The yield curve of US Treasuries (the name for US government bonds) with maturities of three months, two, five, ten, and thirty years are reported on the US Treasury Department’s website each trading day.
Treasury Bills have a short duration and typically offer lower yields than medium-term and long-term bonds. Since fixed income is considered a lower risk asset class, its potential return is lower than equities. Therefore, the demand for long-duration treasuries usually comes from large institutional investors such as pension or insurance funds.
Types of Yield Curve

Normal
A normal yield curve has an upward sloping shape, which indicates that the yields of bonds with a longer duration could continue to increase as a response to periods of elevated economic activity. A normal yield curve implies investors are confident that the economy will grow more quickly, and mortgage and loan rates would follow the yield curve. In practice, longer-term loans require a higher interest rate than shorter-term ones.
Flat
A flat yield curve indicates that investors expect slower growth, and as a result, yields are low across the board. It typically sends mixed signals about the potential economic output. A flat yield curve would also mean that the difference between long and shorter-term rates is insignificant.
Inverted
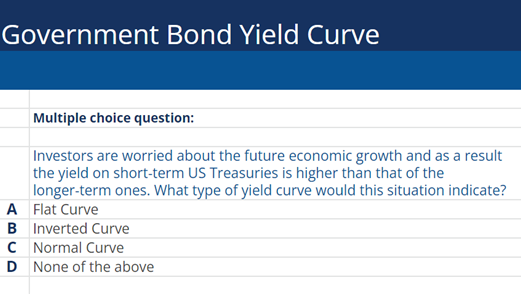
An inverted yield curve is downward sloping and signals an economic recession. Investors would typically have low confidence in the economy, and the yields on bonds with a shorter duration are higher than those with a longer duration.
Humped
A humped yield curve, also known as a bell-shaped yield curve, is a rare type of yield curve that occurs when interest rates on medium-term fixed income securities are higher than the rates of both long and short-term instruments.
