Solvency Ratios
May 21, 2021
What are “Solvency Ratios?”
Solvency refers to a company’s ability to pay or meet its long-term financial obligations, including interest and principal payments on bank loans or bonds. The ratios that measure this ability are known as Solvency Ratios. These ratios assess a company’s long-term financial health and stability and are one way to analyze a company’s balance sheet.
Solvency ratios provide valuable insights into the relative amount of debt in a company’s financial structure and whether it has sufficient cash flows to cover payments related to long-term debt obligations as and when they are due.
Key Learning Points
- There are six common solvency ratios (among others) used to assess a company’s long-term financial health and stability; and
- The higher (lower) these six ratios are, the greater (lower) the risk of insolvency of a company, except the interest coverage ratio where the higher (lower) the ratio the lower (greater) the risk of insolvency.
Types of Solvency Ratios
There are six commonly used solvency ratios (among others), these are:
- debt-to-assets, debt-to-capital
- debt-to-equity, financial leverage,
- interest coverage
- long-term debt-to-equity
The formulas of these ratios and their interpretation are stated below in brief:
Solvency Ratios Formula
Debt-to-assets Ratio Formula
Debt-to-assets ratio = (Outstanding Debt = Short-Term Debt + Long-Term Debt) / Total Assets
This ratio is a measure of financial risk, it measures the extent to which a company’s debt supports its assets. In other words, the percentage of total assets of a company that is funded by debt. The higher this ratio is, the greater the risk of insolvency.
Debt-to-capital Ratio Formula
Debt-to-capital ratio = (Outstanding Debt = Short-Term Debt + Long-Term Debt) / (Capital = Short-Term Debt + Long- Term Debt + Total Shareholders’ Equity)
This ratio gives us an idea of a company’s financial structure and measures a company’s total liabilities against its capital. A higher ratio indicates a higher risk of insolvency.
Debt to Equity Ratio Formula
Debt to equity ratio = (Outstanding Debt = Short-Term Debt + Long-Term Debt) / Shareholder’s Equity
This ratio measures how much debt a company has relative to equity. A higher (lower) debt-to-equity ratio indicates higher (lower) risk of insolvency.
Financial leverage Formula
Financial leverage = Average Assets (Year 1 + Year 2/2) / Average Shareholder’s Equity (Year 1 + year 2/2)
This ratio measures the amount of assets of a company that are supported by each unit ($) of equity. For example, if this ratio is 3.5, it means that every US$1 of equity is supporting US$ 3.5 worth of assets. Therefore, the higher this ratio, the weaker the solvency position of the firm.
Interest Coverage Formula
Interest coverage = EBIT / Interest Expense
This ratio is a measure of a company’s ability to meet its interest payment on debt obligations with the current earnings before interest and taxes (EBIT). A lower interest rate coverage indicates greater solvency risk and less assurance that a company can service its debt obligations.
Long-term debt to assets ratio Formula
Long-term debt to assets ratio = Long Term Debt / Shareholder’s Equity
This ratio is a measure of financial risk, it measures the extent to which a company’s long-term debt supports its assets. In other words, the percentage of total assets of a company that is funded by long-term debt. The higher this ratio, the greater the risk of insolvency.
Six Solvency Ratios – Excel Example
Learn to How Calculate Solvency Ratio
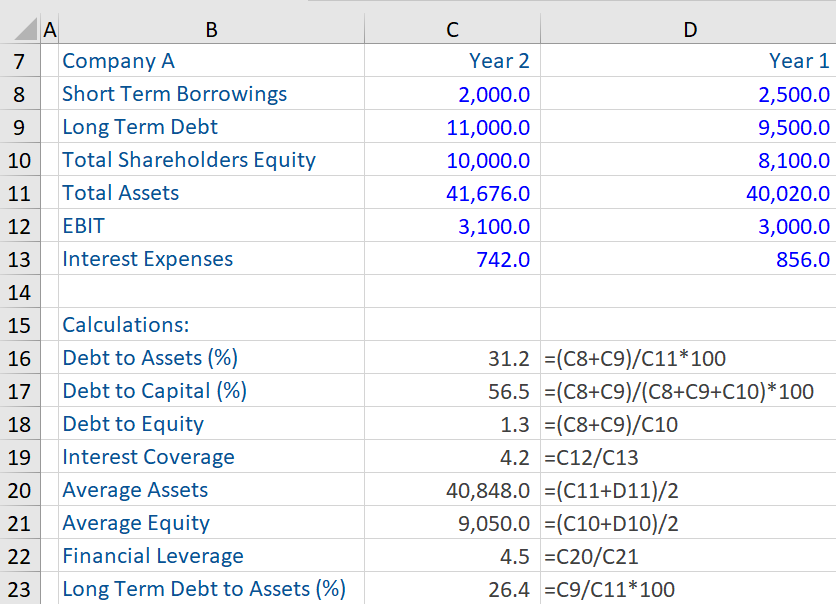
Given below is the following data (Year 1 and Year 2) from the annual accounts of a company. Based on this information, six solvency ratios (mentioned above) for Year 2 have been computed.
The calculation below shows that this company had a debt-to-assets ratio of 31.9% in year 2 i.e., 31.9% of the company’s assets are financed by debt. Likewise, calculations of other ratios can be interpreted per the previously mentioned definitions.


